spectral representation of a convolutional graph filter

Data

Spectral representation of a graph convolution

Spectral Representation of a Convolutional Graph Filter

in the spectral/frequency domain, we have

y^=k=0K1hkΛkx^

this representation is completely defined by the polynomial h(λ)=k=0K1hkλk
^representation

Frequency Response

The spectral representation/frequency response of H(S) is

H(S)^=k=0K1hkΛk

^response

Spectrum Representation as Sampling from a Polynomial

Because the spectral representation of a graph filter is independent from the graph and the spectral graph filter operates on a signal pointwise, this tells us

  1. The polynomial is fixed once we find the coefficients hk.
  2. We can think of H(S)^ as sampling values λi along the curve h(λ)=k=0K1hkλk.

Thus, changing the shift operator
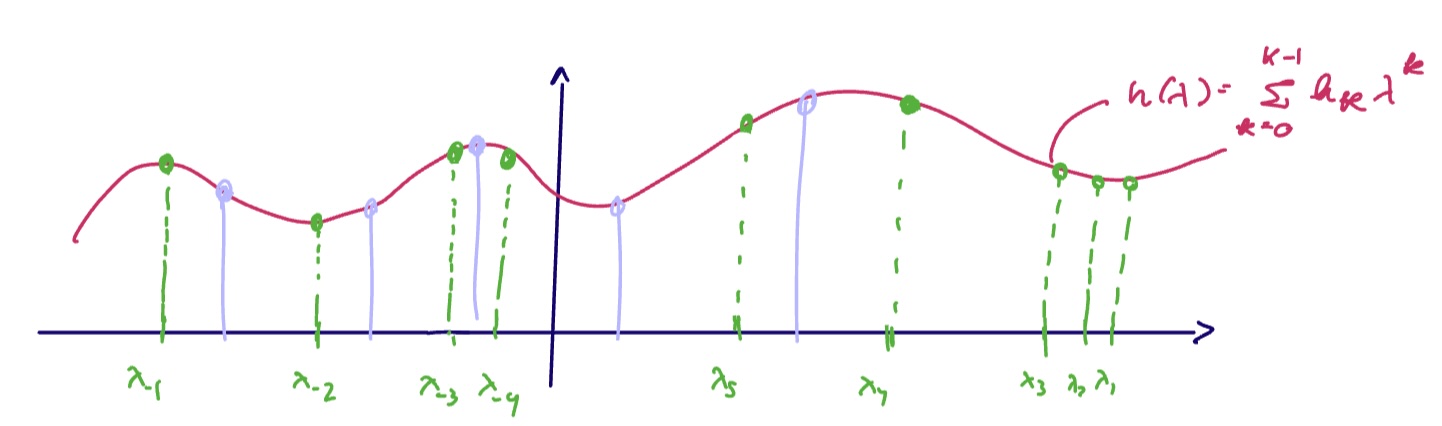
 S corresponds to a different set of points sampled from this polynomial.

2025-01-29_graph1.jpg
^spectral-as-poly

Spectral Representation of a Graph Signal

The graph fourier transform of the filtered signal is given as

y^=Vy=Vk=0K1hkSkx=Vk=0K1hkSk(Vx^)()=k=0K1hkV(VΛV)kVx^=k=0K1hkΛkx^

For (), recall the definition of the inverse graph fourier transform.

We can see then that the GFT of the filter and the operator have the same polynomial relationship, but in the spectral domain.

Notes

Mentions

File
ChebNet
GNNs perform better than their constituent filters
Lipschitz filters are stable to additive perturbations
discriminability of a graph filter
fixed coefficients yield the same spectral response for both graphon and graph convolutions
integral Lipschitz filter
lipschitz graph filter
spectral representation of graphon convolutions
the spectral graph filter operates on a signal pointwise
the spectral representation of a graph filter is independent from the graph
2025-01-29 graphs lecture 3
2025-02-03 graphs lecture 4
2025-02-17 graphs lecture 8
2025-03-05 graphs lecture 12
2025-03-10 graphs lecture 13
2025-03-24 graphs lecture 14
2025-04-02 lecture 17
Homework 3